None
Note
This tutorial was generated from an IPython notebook that can be downloaded here.
Creating custom focal statistic function
import pyspatialstats.focal as fs
import pyspatialstats.rolling as rolling
import rasterio as rio
import matplotlib.pyplot as plt
import numpy as np
import os
os.chdir('../../../')
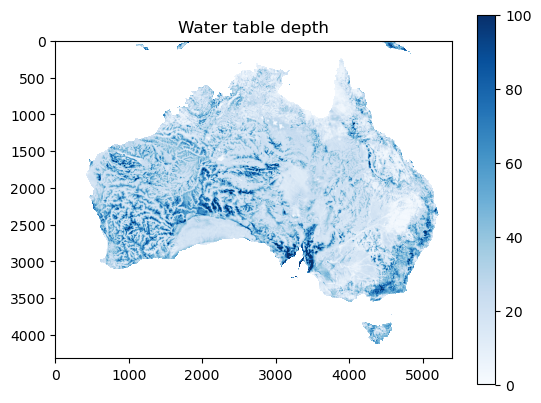
Loading raster (containing water table depth (Fan et al., 2017)).
with rio.open('data/wtd.tif') as f:
    a = f.read(1).astype(np.float64)
    a[a == -999.9] = np.nan
Inspecting the data
plt.imshow(a, cmap='Blues', vmax=100)
plt.title('Water table depth')
plt.colorbar()
<matplotlib.colorbar.Colorbar at 0x154d85010>
Creating custom focal mean
Firstly, a windowed version of the input raster needs to be defined.
a_windowed = rolling.rolling_window(a, window=5)
print(a.shape, a_windowed.shape)
(4320, 5400) (4316, 5396, 5, 5)
This windowed version has a slightly different shape on the first two axes. This is because there is no window behaviour defined on the edges. If this is undesired the original array can be padded with the missing number of columns and rows with numpy.pad. Through this function many different edge value assumptions can be made. Here I use the example of continuing with the closest values.
a_padded = np.pad(a, pad_width=2, mode='edge')
a_windowed_padded = rolling.rolling_window(a_padded, window=5)
print(a.shape, a_windowed_padded.shape)
(4320, 5400) (4320, 5400, 5, 5)
This has the result that the input and output raster share their first two axes.
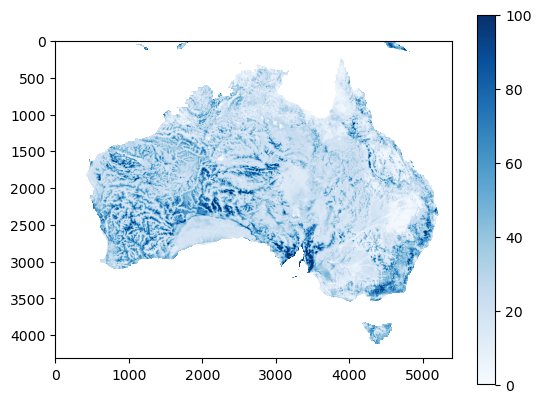
Now the only thing that needs to happen is a mean operation on the third and fourth axes:
a_mean = a_windowed.mean(axis=(2, 3))
Plotting this shows that the operation generates an image that is very close to the original raster, with some limited smoothing
plt.imshow(a_mean, cmap='Blues', vmax=100)
plt.colorbar()
<matplotlib.colorbar.Colorbar at 0x154f62c10>
This can be captured in a custom focal mean function as follows:
def custom_focal_mean(a, window):
    a_windowed = rolling.rolling_window(a, window=window)
    return a_windowed.mean(axis=(2, 3))
This comes close to the focal_mean function implemented in this
codebase
plt.imshow(fs.focal_mean(a, window=5).mean, cmap='Blues', vmax=100)
plt.colorbar()
<matplotlib.colorbar.Colorbar at 0x15504ccd0>

Note that for custom_focal_mean, if a single NaN-value is present in
the window, it results in a NaN-value. The focal_mean function in
this package deals with this in a better way through the
fraction_accepted parameter.